Work About Contact Request a briefing
ENRU

Geospatial intelligence · Central Asia

Know where the water actually went.

GEOBOX turns satellite imagery into field-level evidence for the people who manage Central Asia's water, farmland and cities. Built on more than a million observations collected in the field — not inferred from open data.

1M+
Field observations behind our models
8M ha
Irrigated land under monitoring
179k
Fields scored for water productivity
10+ yrs
Of ground campaigns across the region
Water use intensity — Qashqadaryo, 788,000 ha
GEOBOX analytics interface showing field-level water use intensity across Qashqadaryo, Uzbekistan, with a per-district efficiency table
Water use intensity across 788,000 hectares in Qashqadaryo, Uzbekistan — every parcel scored against what it actually consumed.

GEOBOX delivers to regional water authorities, agricultural agencies and city administrations across Central Asia — from district-scale irrigation audits to an urban heat platform built for a single city.

The problem

Central Asia's water is allocated on paper. It has to be measured on the ground.

Irrigation across the region is still steered by allocation records — how much water a district was assigned, not how much its fields consumed. Some parcels are drowned, others starved, and until the season closes nobody has the evidence to say which.

Satellite data only closes that gap if somebody has checked it against reality. Ours has been.

8M ha

Irrigated land across Central Asia, most of it managed on allocation figures rather than consumption data.

50%

Of applied water lost before it reaches the farm gate in the weakest-performing districts.

40%

Year-to-year swing in yield — largely predictable once the inputs are field-validated.

10+ yrs

Of ground campaigns behind our training data. That baseline is not something a general-purpose model can borrow.

What we do

Four capabilities. One validated region.

Each one is a deliverable, not a dashboard subscription: the analysis, the data layer underneath it, and a tool your team can operate without a GIS department.

Irrigation efficiency audits

Field-level water productivity from actual evapotranspiration set against applied water. Every parcel scored, every district benchmarked, the underperformers named and located.

For water authorities, basin agencies and irrigation districts
Crop & field mapping

Multi-temporal optical and radar fusion resolves crop type at parcel level and separates irrigated land from rainfed — a base layer everything else can sit on.

For agriculture ministries, agri-lenders, insurers and agribusiness

Pest & climate risk

Habitat suitability crossed with climate stress anomaly, trained on multi-year field records, to flag where an outbreak is building while the cheap window is still open.

For plant protection services and emergency planners

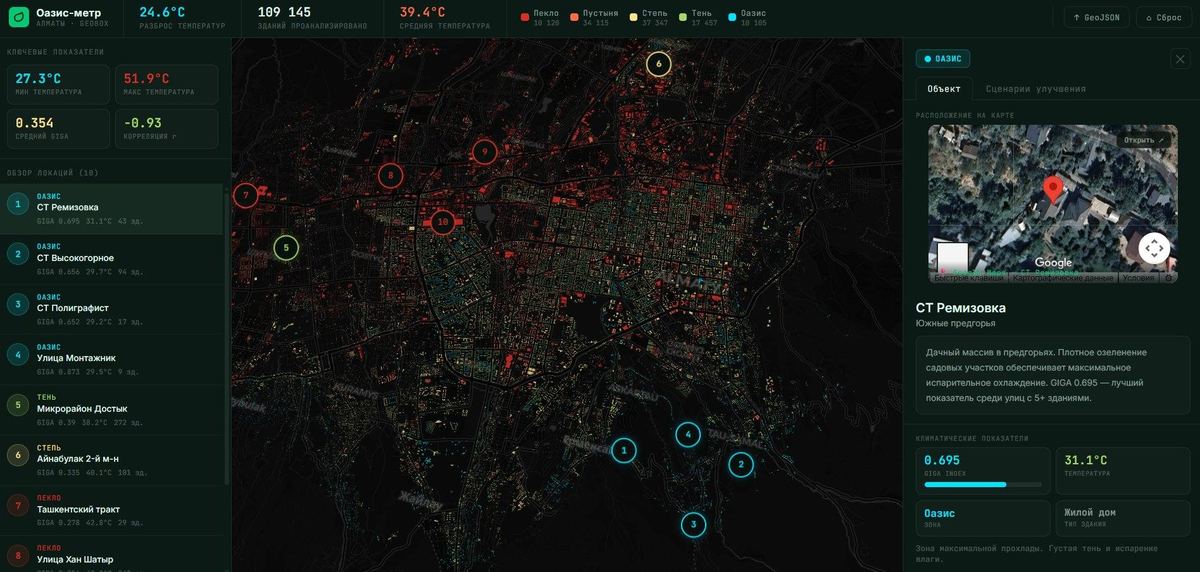
Urban heat mapping

Land surface temperature and emissivity resolved to the individual building, with an intervention calculator that prices the cooling before anything is planted.

For city administrations, urban planners and architects

How we work

From raw satellite signal to a decision someone can defend.

Three steps, in this order. The first one is the one most vendors skip.

Step 01

Ground truth first

Multi-sensor imagery — Landsat, Sentinel, Planet, UAV — fused with more than a million labelled field observations from our own campaigns across the region. Sensor-agnostic by design, so the method survives a change of satellite.

Step 02

Models built for the problem

Purpose-built classifiers trained on our own dataset, not general models nudged in a plausible direction. Accuracy is reported at field level, against parcels our teams have physically stood in.

Step 03

Tools your team can run

Most clients have no in-house geospatial team and should not need one. We hand over an interface built for the person who acts on the answer: the water manager, the agronomist, the city planner.

Selected work

Delivered, not demonstrated.

Four projects across water, agriculture, pest risk and urban climate — each validated against data collected on the ground.

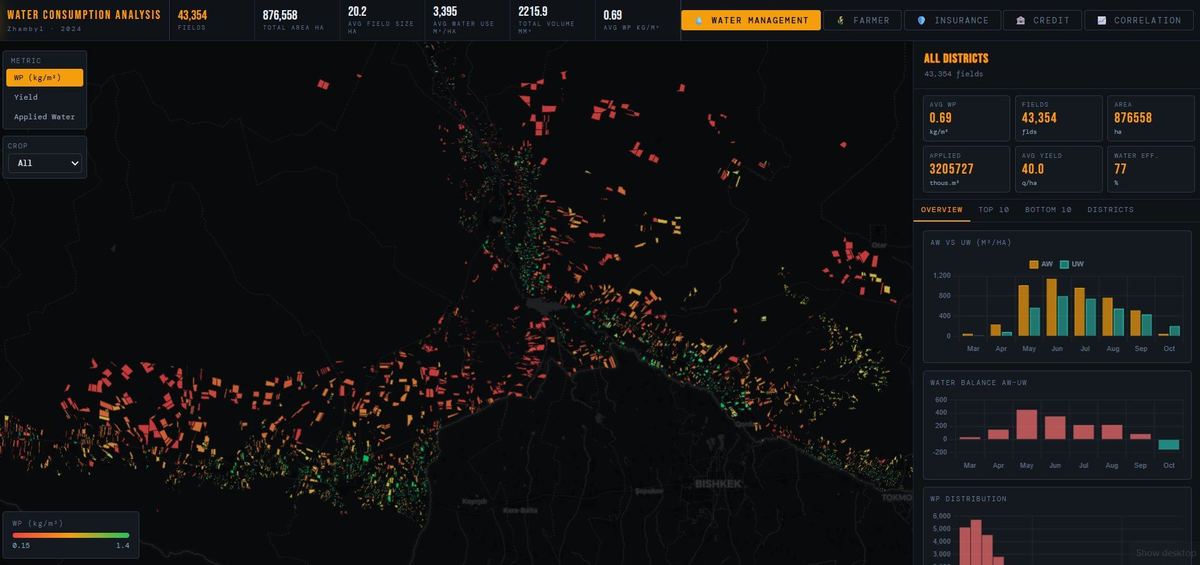
GEOBOX water consumption analysis for Zhambyl Oblast, Kazakhstan: 43,354 fields plotted by water productivity with monthly water balance charts

Water · Qashqadaryo, UZ & Zhambyl, KZ

Irrigation efficiency audit

Water productivity scored for every field across 788,000 hectares, and the underperformers put on a map.

ETa / applied water788k haLandsat 8/9
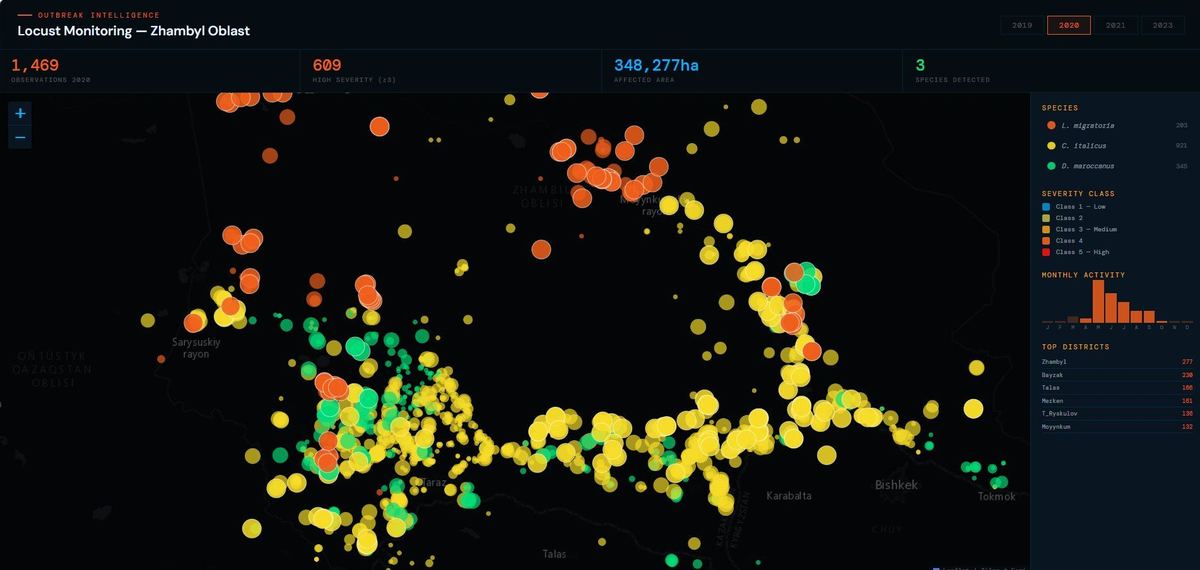
GEOBOX locust monitoring map of Zhambyl Oblast showing 1,469 observations by species and severity class across 348,277 hectares of affected area

Pest risk · Southern Kazakhstan

Locust outbreak forecasting

Two independent outbreak pathways, separated — and flagged by district before the season starts.

Habitat suitability5,440 records2019–2023
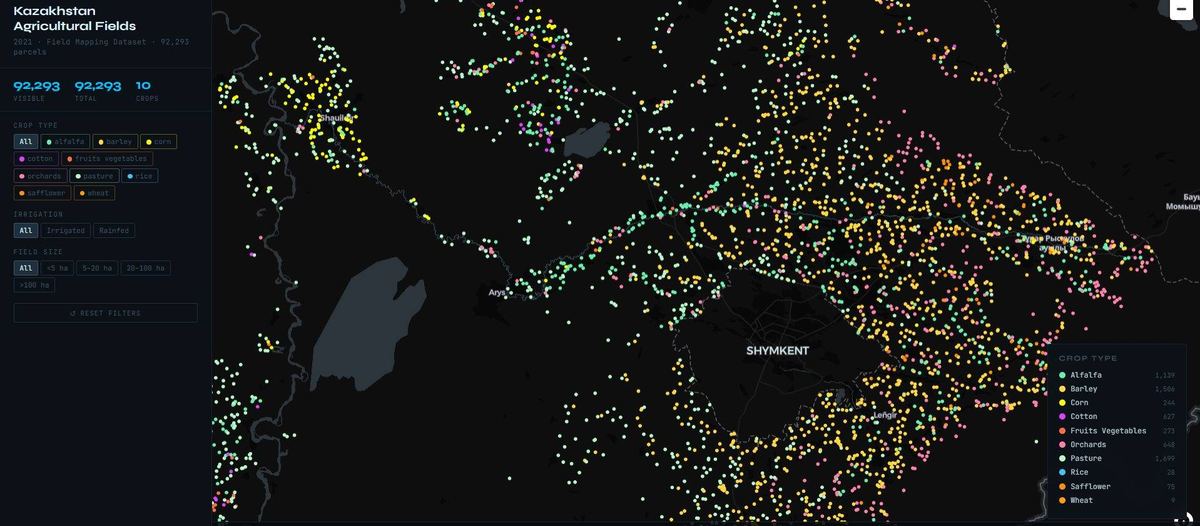
GEOBOX crop classification map around Shymkent, Kazakhstan, showing 92,293 agricultural parcels coloured by ten crop types

Agriculture · South Kazakhstan

Crop classification & field mapping

92,293 parcels classified into ten crop types, with irrigated land separated from rainfed.

NDVI + SAR92,293 parcels10 classes

See all four in detail

Why it holds up

A model is only as honest as the ground it was checked against.

Our classification and risk models are trained against more than a million field-labelled observations gathered across Central Asia over a decade of campaigns.

That baseline is the difference between a map that looks plausible and a number a regulator will sign. It is also the part that cannot be bought, scraped, or prompted into existence.

Work with us

Tell us the decision. We will tell you what the data can carry.

Auditing an irrigation network, underwriting a season, forecasting an outbreak, cooling a city — we start from the decision in front of you, not from a platform demo.